State of the market
Total January projected spending across video game hardware, content and accessories grew 3% when compared to a year ago, to $4.7 billion. A 23% increase in subscription spending and 16% growth in hardware fueled the gain.

Software
January video game content spending grew 3% when compared to a year ago, to $4.3B. A 23% increase in subscription spending combined with slight gains across Console (+2%) and PC (+1%) content to offset a small drop in mobile (-1%) (mobile source: Sensor Tower).
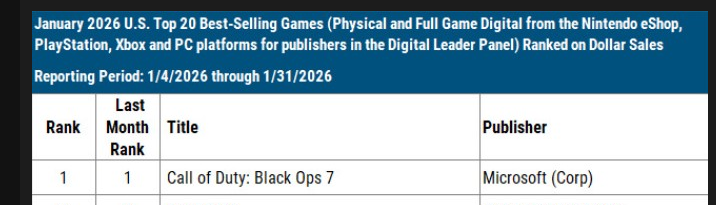
Final Fantasy VII: Remake jumped to 9th in January from 225th in December due to the release of the Switch 2 and Xbox Series versions of the game during the month.
Hardware
Hardware spending increased 16% when compared to a year ago, reaching $248M. Nintendo Switch 2 spending was able to offset year-on-year declines seen across PlayStation 5 (-17%), Xbox Series (-27%) and Switch (-79%). Despite sales falling compared to a year ago, PlayStation 5 led the hardware market in both unit and dollar sales during January 2026. Nintendo Switch 2 ranked 2nd across both measures.
Mobile
Sensor Tower reports the top 10 mobile games in Jan and rank chg from Dec as: MONOPOLY GO!, Royal Match (+1), Last War: Survival (-1), Candy Crush Saga, Gossip Harbor (+1), Kingshot (-1), Whiteout Survival (+1), Royal Kingdom (+1), Township (+2) and Free Fire (+2).
"The Clash Royale show seems to be officially over, as the game falls out of the top 10 ranking with -49% revenue over Dec 2025," said Sam Aune of Sensor Tower. "The game to keep your eye on is Loom Games' Pixel Flow!, which grew IAP revenue 79% month over month."
Accessories
Accessories spending dipped 5% compared to a year ago, to $185M This is the lowest January accessories spend total since January 2020 ($143M).
Software Charts


Rankings
Units: PS5 > NS2 > XBS > NSW > NEX > PC Portable
Revenue: PS5 > NS2 > XBS > PC Portable > NEX > NSW
Credits: Piscatella for the data, and Welfare for the thread formatting.


Last edited by a moderator: