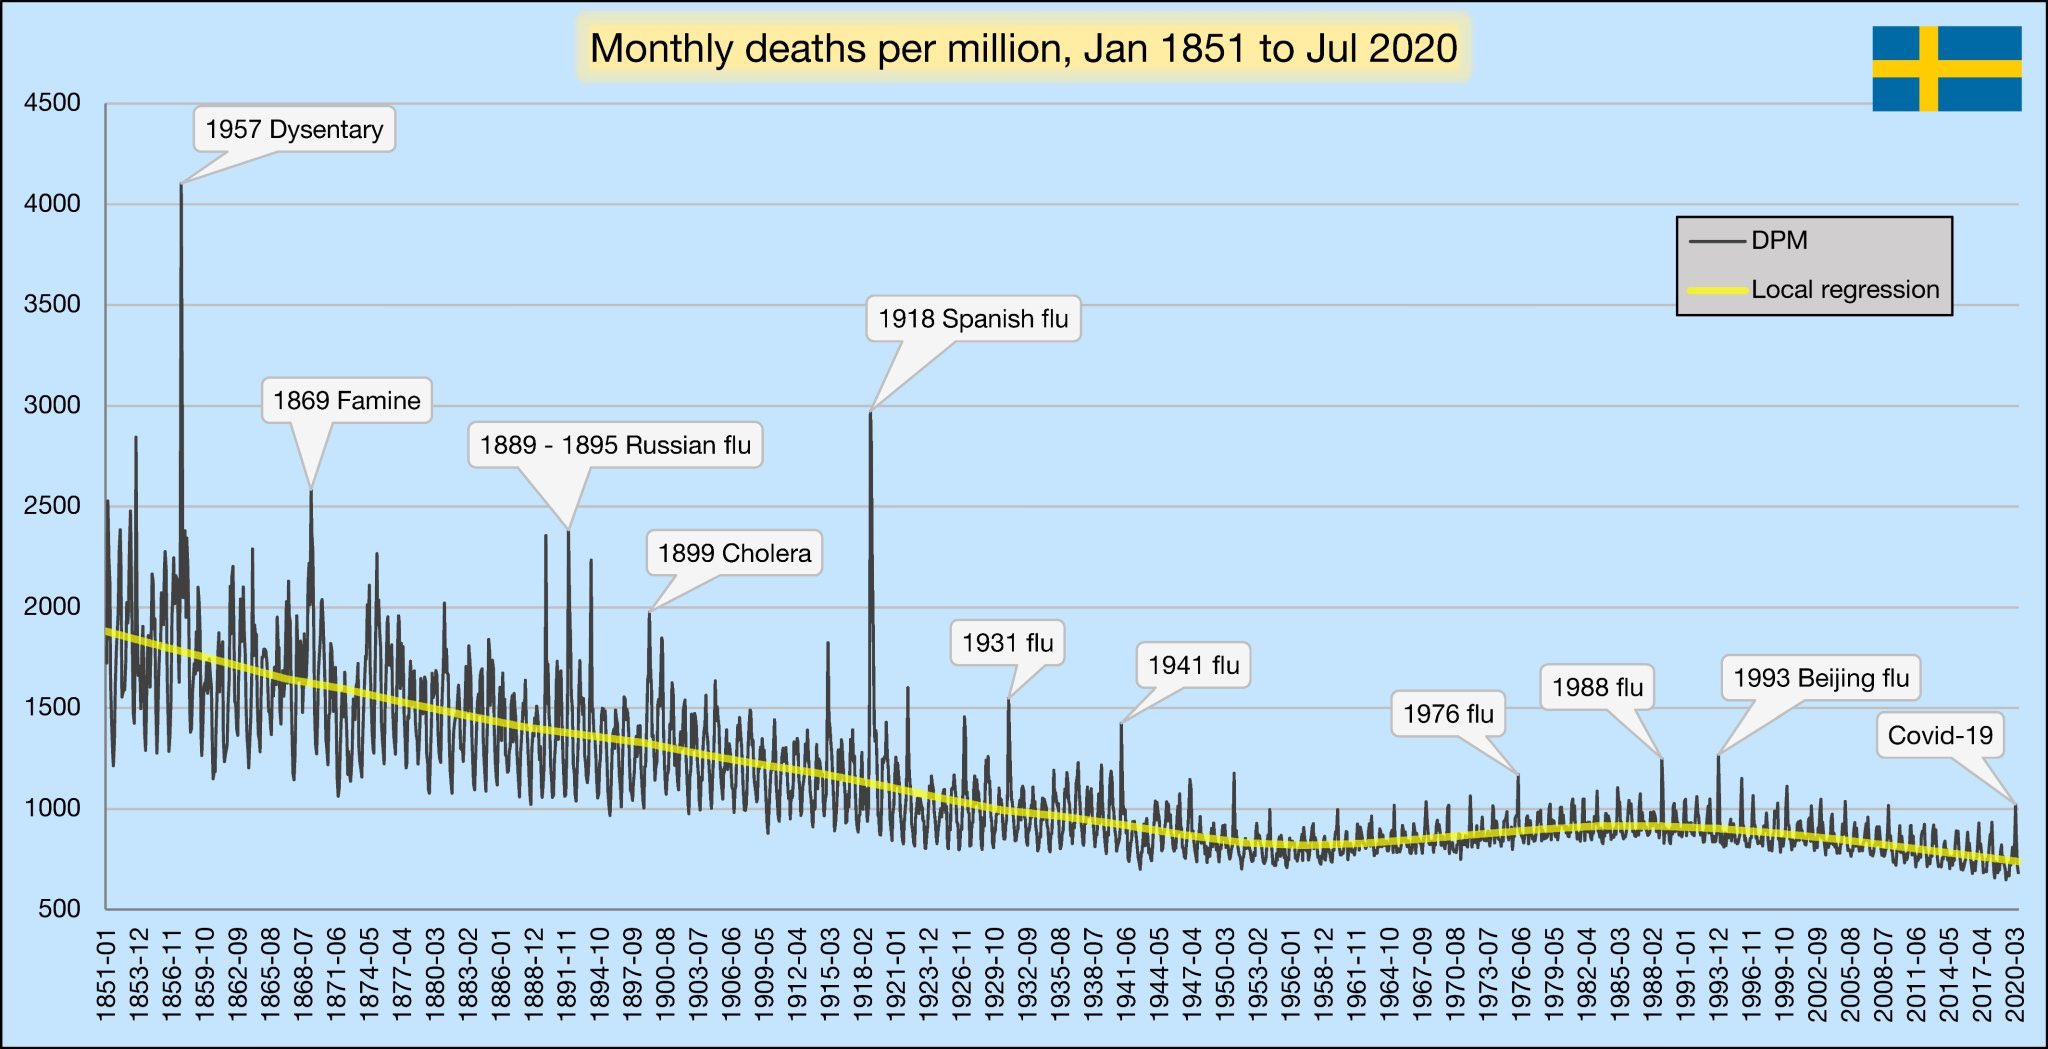
Covid 19 is seasonal. When I can look at a graph of various countries I was able to identify start of Autumn, End of Winter with 90% success rate.
Check out the graph of South Africa, notice the flat line.

 www.worldometers.info
If I'm correct you are going to see 2000 cases each day for the next 4 months.
That means end of spring/start of summer.(flat line)
The downward trend is Spring.
The start of the curve is Autumn, The peak happen in winter.
Check out the graph of South Africa, notice the flat line.

South Africa COVID - Coronavirus Statistics - Worldometer
South Africa Coronavirus update with statistics and graphs: total and new cases, deaths per day, mortality and recovery rates, current active cases, recoveries, trends and timeline.
If I'm correct you are going to see 2000 cases each day for the next 4 months.
That means end of spring/start of summer.(flat line)
The downward trend is Spring.
The start of the curve is Autumn, The peak happen in winter.
Last edited:


