Looking through Nintendos financial papers you can find a lot of interesting data, so I thought that it would be good to analyze the what we have.
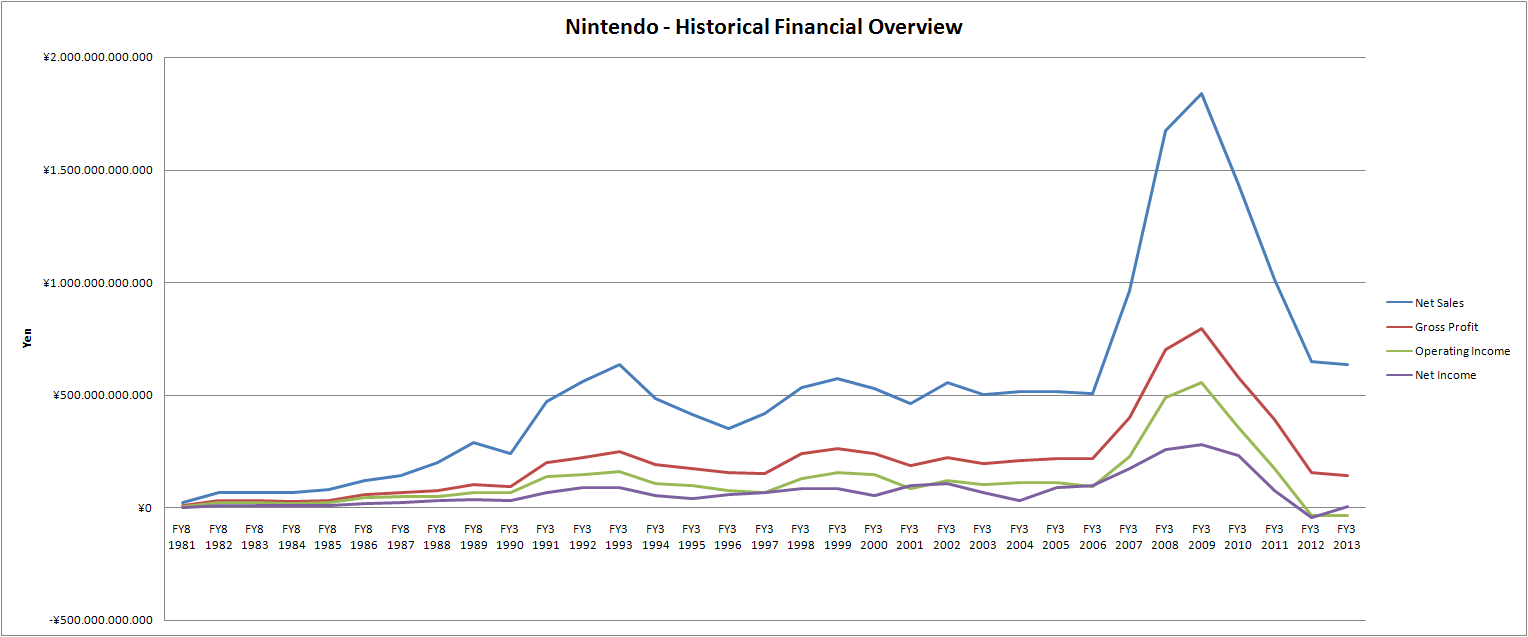
First of all, I'll start with a big historical overview of Nintendos overall business.
Net Sales
"In bookkeeping, accounting, and finance, Net sales are operating revenues earned by a company for selling its products or rendering its services.
Also referred to as revenue, they are reported directly on the income statement as Sales or Net sales."
Gross Profit
"In accounting, gross profit or sales profit is the difference between revenue and the cost of making a product or providing a service, before deducting
overhead, payroll, taxation, and interest payments."
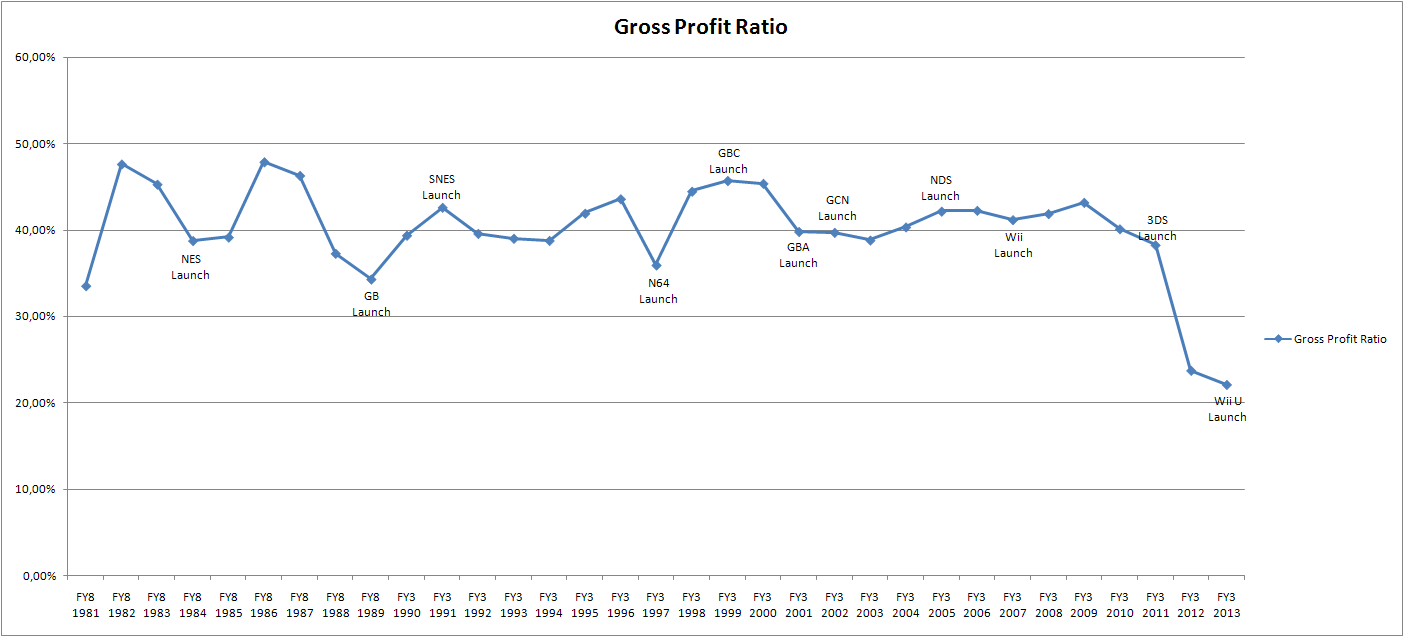
Gross Profit
I think this chart is well known, Nintendo always generated money (aside from FY3 2012), as well as the big Wii & NDS - spike.
As you can see, the net sales graph is Nintendos revenue generated by their products.
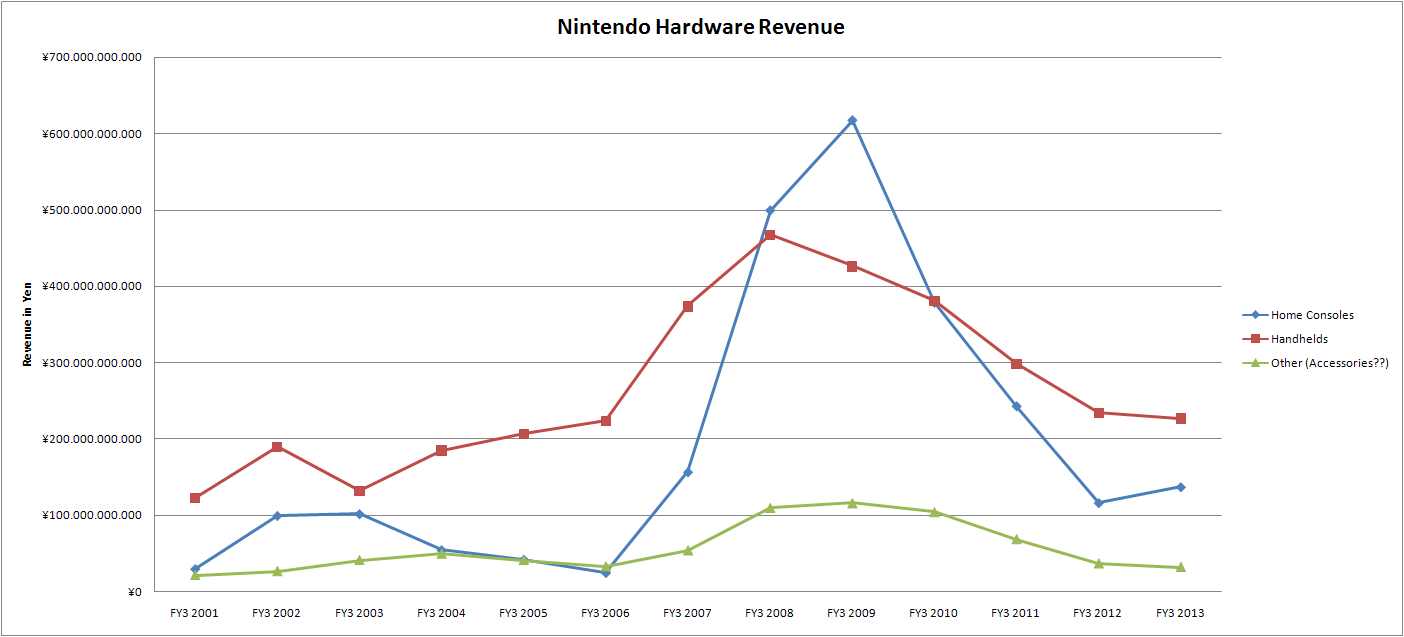
Going deeper into their files you can find a breakdown of their revenues.
Unfortunately, Nintendo started with the breakdowns with FY3 2001, so we don't have
data prior to this, but here's the current chart:
Most surprisingly, Nintendo generates more revenue with their hardware (consoles + handhelds + accessories + other) than with their software (retail + digital + royalties).
You have to consider that Wii & NDS have combined software sales of 1.802.750.000 units.
Considering this, you can say that people saying that Nintendo should abandon their hardware is quite a crazy idea, because it makes up to 60% of their business.
Furthermore, Nintendos business works like a clock, one gear works together with the second gear and so on.
Their hardware gives them their base for their own software sales, for accessory-sales, royalties and the possibility for their own online infrastructure (I'll come back to the online infrastructure later).
Nintendo managed to ship around 700.000.000 of it's own software titles during their Wii & NDS - age and still didn't manage to generate higher revenues than their hardware,
of course, Wii & NDS had great hardware sales, but unlike the first year in the chart, hardware beats software everytime.
Just another thing, Nintendo would've to sell 759.319.667 games per year at 5 $ in the App Store to account for the hardware revenue. And 30 % goes to Apple. (Comparing last fiscal year)
From a financial point, one crucial thing for Nintendo is that they sell their hardware beneath the production price,
one problem that occured with the 3DS (resolved by now) and the Wii U (still sold under price) and one of the
big reasons why they generate operating losses in the last few quarters.
People saying that Wii U should be 200 $ or less is wishful thinking and not really an option. It's their fault though, because they should've planned this better (and other things like marketing, etc.),
but ok, this is quite an unpredictable market if you want to predict long term sales.
So, let's analyze the hardware revenues even further:
There's a section in the report called "Other", I suppose these are accessories and maybe other things I can't think of now.
It's quite unfortunate that we don't have older reports, but you could say that Nintendos hardware business during the GCN-days
was mostly driven by the handheld-division, hence, even the "Other-section" generated more revenue than the GCN.
The Wii is somewhat of an anomaly, it even managed to outpace the NDS in two years, thanks to the high sales and higher price-point.
It would've been quite interesting to see the breakdown for the NES-, SNES- and N64-generation, in comparison to the Game Boy and Game Boy Color.
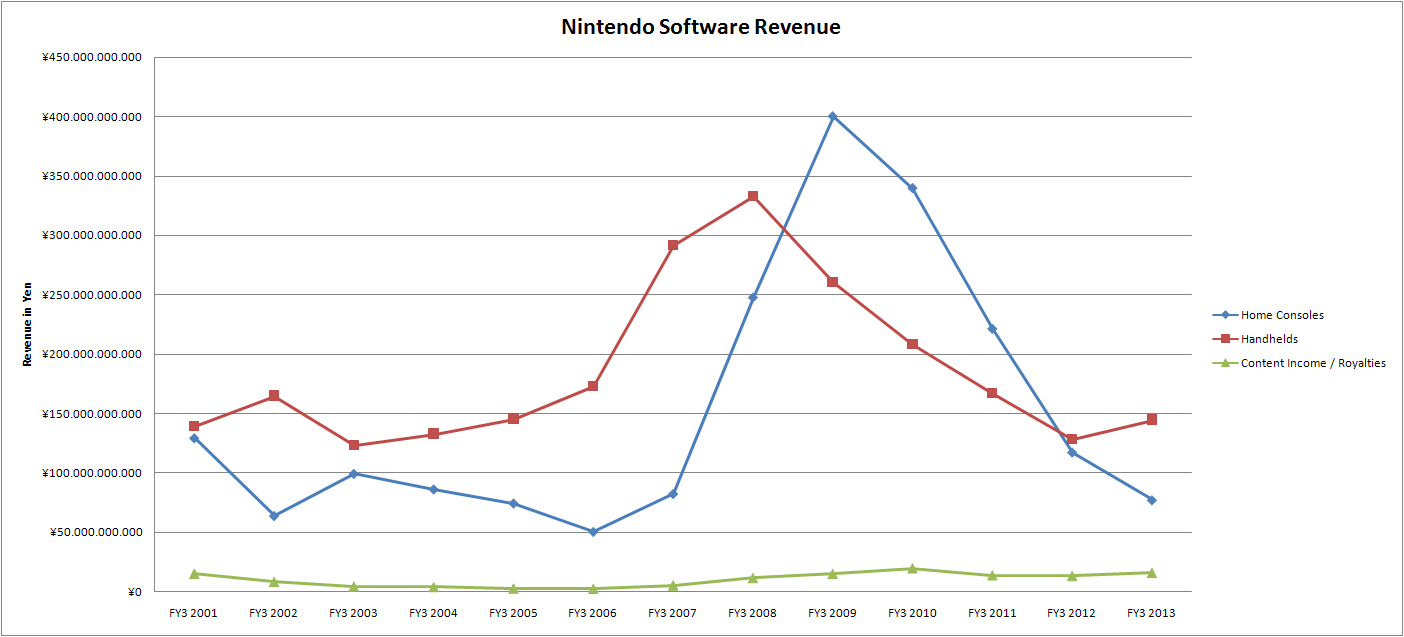
Now, lets move on to the software:
It's quite similar to the hardware graph, but one thing got me interested.
There's a section in the reports that's called "Content income", looking through older reports, it was declared as "royalties & content income", I think it's still the same.
So I believe these are the 3rd Party licencing fees that Nintendo earns. If you have further information what this could be, please elaborate.
Most surprisingly for me is the fact that Nintendo generates like 10 to 100 times more revenues with their own software than with 3rd Party royalties (Content income).
The 3rd Party sales on the Wii & NDS havn't been bad at all (considering the overall mass).
Code:
		Nintendo Software Revenues
		to 3rd Party Earnings Ratio

FY3 2001	18,0
FY3 2002	27,7
FY3 2003	50,0
FY3 2004	56,3
FY3 2005	82,4
FY3 2006	92,1
FY3 2007	70,6
FY3 2008	50,4
FY3 2009	44,3
FY3 2010	28,1
FY3 2011	28,4
FY3 2012	18,6
FY3 2013	14,0
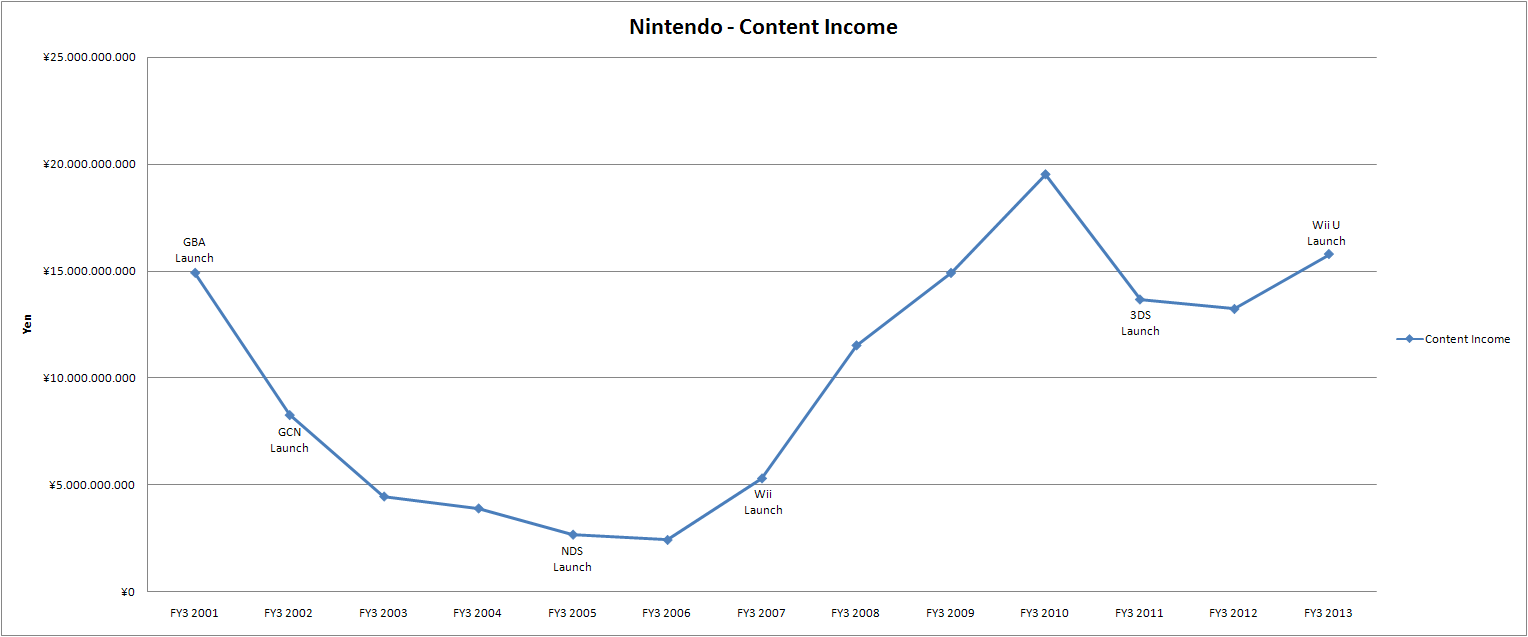
So, compared to Nintendos own revenues, the content income graph seems absimal, so I created another chart for this, because these are still hundreds of millions of dollars:
And to give you a clue how much this is in Dollars, here's another breakdown (I used historical exchange rates, so the curve should look different than the original):
FY3 2009: 148.378.000 $
FY3 2010: 210.120.000 $
FY3 2011: 159.490.000 $
FY3 2012: 167.440.000 $
FY3 2013: 190.320.000 $
I think it's quite interesting that the chart is still quite high since the 3DS launch, because overall software sales are far behind what NDS & Wii achieved, I have no explanation for this.
So, moving to another topic and discussing Nintendos
direct hardware & software profitability.
One of Nintendos secrets of their success (over 36 years in the gaming market and only one year with net loss) is the well known fact that
they sell their hardware for less than the production price. (3DS & Wii U being the exception).
Furthermore, their software margins are extremely high because they don't have to pay royalties and don't have to share the price between developer & publisher.
I already mentioned what the gross profit is:
Gross Profit
"In accounting, gross profit or sales profit is the difference between revenue and the cost of making a product or providing a service, before deducting
overhead, payroll, taxation, and interest payments."
The gross profit ratio gives us a clue about Nintendos profitability in terms of direct production costs compared to the net income:
Nintendo gross profit ratio shows us that Nintendo these two points give them margins around 40%. One of the reasons why Nintendo
earned money during the GCN-days, while Sony made loss, despite the PS2 being the best selling home system to date.
Now, like you see at the end of the chart, the graph turns downward, because of the 3DS & Wii U - production costs.
This is currently Nintendos biggest problem in terms of profitability. This is one reason why Nintendo won't cut the Wii U - price
by a big amount.
So, you have to consider that Nintendo has low-margin-hardware & higher production cost for their software thanks to the HD-age.
What can they do or what will they do?
Because of this, Iwata took some actions to raise the profitability again, this is also a section about Nintendos future plans:
You probably know that Nintendo builds a new R&D-building next to their Kioto-headquarters. The construction took them
about 200.000.000 $ (this is also something that ................)
Unified hardware divisions
Reducing Wii Us production costs
Driving the online business
Nintendos online business saw a big growth in the last quarters/years:
Currently, it even makes up 10% of their software business:
FY3 2007 0,61 %
FY3 2008 1,32 %
FY3 2009 1,46 %
FY3 2010 2,10 %
FY3 2011 1,99 %
FY3 2012 3,02 %
FY3 2013 6,90 %
FY3 2014 10,92 % two quarters
In this case, Nintendos software margin is 100%, so it's quite obvious that they push this segment.
Maybe this is an explanation for Nintendos big indie-shift with the 3DS & Wii U now that they see the benefits of their online-segment.
")
 .
.