Parmenides
Banned
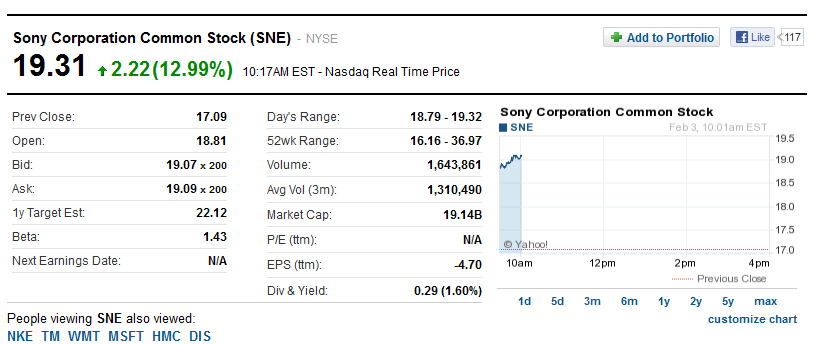
Sony should consider losing more money next quarter: http://finance.yahoo.com/q?s=SNE

---
Consolidated Results for the third quarter ended Dec 31, 2011
PS3 Worldwide Unit Sales (Unit:Million)
PS2 Worldwide Unit Sales (Unit:Million)
PSP Worldwide Unit Sales (Unit:Million)
Sony Q3

Hardware Shipments (Unit: Million)
LTD
FY 2011
-For the current Fiscal Year ending March 31, 2012, Sony expects to sell 14 million PS3s, 6 million PSPs and 4 million PS2s
-For the current Fiscal Year ending March 31, 2012, Nintendo expects to sell 14 million 3DS, 10 million Wiis and 6 million NDS
-Microsoft's Fiscal Year starts in July
2011
Microsoft Q2
Nintendo Q3
Sony Discusses F3Q11 Results (Seeking Alpha)
CPS Segment
Game Business

---
Consolidated Results for the third quarter ended Dec 31, 2011
Sony Corporation said:(Millions of U.S. dollars)
Sales and Operating Revenue --> $ 23,370
Operating Loss --> $ 1,176
Net Loss --> $ 2,038
PS3 Worldwide Unit Sales (Unit:Million)
Code:
Hardware Sales   Ap-Jn    Jl-Sp    Oc-Dc    Ja-Mr     FY       LTD

FY 2006/07         -        -       1.7      1.8      3.5      3.5

FY 2007/08        0.7      1.3      4.9      2.2      9.1      12.6

FY 2008/09        1.6      2.4      4.5      1.6      10.1     22.7

FY 2009/10        1.1      3.2      6.5      2.2      13.0     35.7

FY 2010/11        2.4      3.5      6.3      2.1      14.3     50.0

FY 2011/12        1.8      3.7      6.5       -       12.0     62.0


Software Sales   Ap-Jn    Jl-Sp    Oc-Dc    Ja-Mr     FY       LTD

FY 2006/07         -        -       5.2      8.1      13.3     13.3

FY 2007/08        4.7      10.4     26.0     16.8     57.9     71.2

FY 2008/09        22.8     21.2     40.8     18.9     103.7    174.9

FY 2009/10        14.8     23.9     47.6     29.3     115.6    290.5

FY 2010/11        24.8     35.3     57.6     30.2     147.9    438.4

FY 2011/12        26.1     37.4     66.2       -      129.7    568.1
PS2 Worldwide Unit Sales (Unit:Million)
Code:
March 31,2006  Cumulative  Production Shipments of Hardware -> 103.69

Hardware Sales   Ap-Jn    Jl-Sp    Oc-Dc    Ja-Mr     FY       LTD

FY 2006/07        2.3      3.4      6.7      2.4      14.8     14.8

FY 2007/08        2.7      3.2      5.4      2.4      13.7     28.5

FY 2008/09        1.5      2.5      2.5      1.4      7.9      36.4

FY 2009/10        1.6      1.9      2.1      1.7      7.3      43.7

FY 2010/11        1.6      1.5      2.1      1.2      6.4      50.1

FY 2011/12        1.4      1.2      0.9       -       3.5      53.6


March 31,2006  Cumulative  Production Shipments of Software -> 1047.0

Software Sales    Ap-Jn    Jl-Sp    Oc-Dc    Ja-Mr    FY       LTD

FY 2006/07        32.7     47.2     78.6     35.0     193.5    193.5

FY 2007/08        31.1     38.0     60.9     24.0     154.0    347.5

FY 2008/09        19.3     23.2     29.7     11.3     83.5     431.0

FY 2009/10        8.5      11.4     11.2     4.6      35.7     466.7

FY 2010/11        3.4      5.6      5.3      2.1      16.4     483.1

FY 2011/12        1.5      2.8      2.5       -       6.8      489.9
PSP Worldwide Unit Sales (Unit:Million)
Code:
March 31,2006  Cumulative  Production Shipments of Hardware -> 17.03

Hardware Sales   Ap-Jn    Jl-Sp    Oc-Dc    Ja-Mr     FY       LTD

FY 2006/07        1.4      2.0      4.7      1.5      9.6      9.6

FY 2007/08        2.1      2.5      5.7      3.5      13.8     23.4

FY 2008/09        3.7      3.2      5.1      2.1      14.1     37.5

FY 2009/10        1.3      3.0      4.2      1.4      9.9      47.4

FY 2010/11        1.2      1.5      3.6      1.7      8.0      55.4

FY 2011/12        1.8      1.7      2.4       -       5.9      61.3


March 31,2006  Cumulative  Production Shipments of Software -> 47.3

Software Sales   Ap-Jn    Jl-Sp    Oc-Dc    Ja-Mr     FY       LTD

FY 2006/07        9.2      13.2     21.2     11.1     54.7     54.7

FY 2007/08        9.8      12.6     18.3     14.8     55.3     110.0

FY 2008/09        11.8     11.8     15.5     11.2     50.3     160.3

FY 2009/10        8.3      13.0     15.0     8.1      44.4     204.7

FY 2010/11        9.2      11.0     16.5     9.9      46.6     251.3

FY 2011/12        6.6      8.1      11.4      -       26.1     277.4
Sony Q3

Hardware Shipments (Unit: Million)
LTD
Code:
PS2  154.4 --> (Software: 1528.9)

NDS  151.06

GB   118.69

PS1  102.49 --> Cumulative Production Shipments of Hardware

Wii  94.97

GBA  81.51

PSP  75.4 -->  (Software: 324.1)

360  65.8

PS3  62.0

NES  61.9

SNES 49.1

N64  32.93

NGC  21.74

3DS  15.03
FY 2011
Code:
         (Ap-Jn)11    (Jl-Sp)11    (Oc-Dc)11  (Ja-Mr)12    FY 2011

360        1.7          2.3           8.2        -          12.2

PS3        1.8          3.7           6.5        -          12.0

3DS        0.71         2.36          8.36       -          11.43

Wii        1.56         1.79          5.61       -          8.96

PSP        1.8          1.7           2.4        -          5.9

NDS        1.44         1.14          2.06       -          4.64

PS2        1.4          1.2           0.9        -          3.5
-For the current Fiscal Year ending March 31, 2012, Nintendo expects to sell 14 million 3DS, 10 million Wiis and 6 million NDS
-Microsoft's Fiscal Year starts in July
2011
Code:
         (Ja-Mr)11   (Ap-Jn)11    (Jl-Sp)11    (Oc-Dc)11     2011

3DS        3.61        0.71         2.36         8.36        15.03

360        2.7         1.7          2.3          8.2         14.9

PS3        2.1         1.8          3.7          6.5         14.1

Wii        1.36        1.56         1.79         5.61        10.32

PSP        1.7         1.8          1.7          2.4         7.6

NDS        1.82        1.44         1.14         2.06        6.46

PS2        1.2         1.4          1.2          0.9         4.7
Code:
       PS3 Retail Sales (*)     PS3 Shipments


2011	       11.0                 14.1

2010           10.5                 14.4


(*)EU+US+JAP  (Source: Nintendo,NPD,Media Create)
Microsoft Q2
Nintendo Q3
Sony Discusses F3Q11 Results (Seeking Alpha)
CPS Segment
Operating loss was ¥85.7 billion compared to operating income of ¥63.5 billion in last year.
Game Business
TV BusinessNow Game business, sales and operating income decreased year-on-year for the Game business. Although we achieved sales that were basically to our expectation for PlayStation retail which went on sale last year, Game business sales decreased due to the strategic price reduction of the PS3 hardware and decrease in unit sales of PS3 hardware.
Despite an increase in market expenses for network services and impact of the price change of PS3 hardware, we maintain consistent profitability. PS3 hardware unit sales were ¥6.5 million, tying the March 2010 fiscal year for the highest Q3 sales.
Sales in the TV business decreased 42% to ¥237 billion. This was due to a shifting of this unit sales expansion to profitability, price declines resulting from deterioration of operating environment and the impact of the flood. During the quarter, LCD TV unit sales decreased 24% to 6 million units.
Excluding restructuring charges and impairment losses, an operating loss of ¥33.5 billion was recorded. During the quarter, we recorded ¥65.5 billion impairment losses including a ¥53.4 billion of shares in LCD. Operating loss including all of these processes was ¥101 billion.
