Luminoth-4545
Member
Credit: Welfare from InstallBase
State of the market
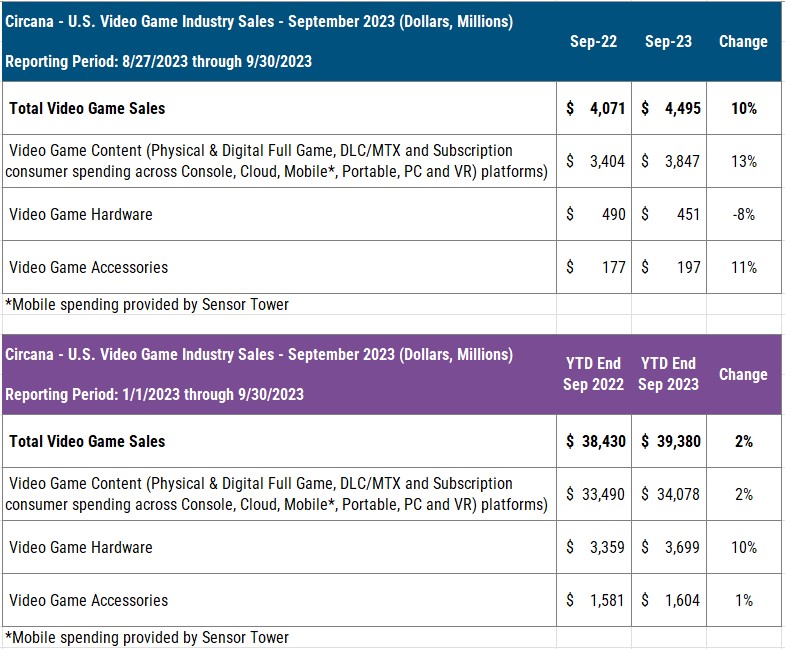
September 2023 US Video Game Market Highlights from Circana - U.S. consumer spending on video game content, hardware and accessories grew 10% compared to a year ago, totaling $4.5B. Growth in spending on video game content and accessories offset an 8% decline in hardware.
Spending on video game content in September increased 13% vs YA, reaching $3.8B. Growth in digital premium download spending across console & PC drove most of the gains. Non-mobile subscription spending fell 2%, while Sensor Tower reported mobile spending growth of 4%.

Hardware
Video game hardware spending fell 8% when compared to a year ago, to $451 million. Single-digit percentage growth in consumer spending on Xbox Series hardware was offset by declines across both PlayStation 5 and Switch.
PlayStation 5 remained the best-selling hardware platform in both unit and dollar sales during September 2023, with Xbox Series again ranking 2nd across both measures.
PlayStation 5 continued to lead the 2023 hardware market across both units and dollars. Year-to-date hardware spending was 10% higher when compared to the same period in 2022, at $3.7 billion.
Software
Starfield was the best-selling game of September, instantly becoming the 7th best-selling game of 2023 year-to-date. Starfield ranked as the best-selling title of the month across both Xbox and PC, with PC being its lead sales platform.
Mortal Kombat 1 debuted as the 2nd best-selling game of September and the #8 best-selling game of 2023 YTD. Mortal Kombat 1 was the best-selling game of the month on PlayStation platforms, placed 2nd on both Xbox and PC, and ranked 3rd on Nintendo Switch.
EA Sports FC 24 was the 3rd best-selling game of September. Double-digit percentage growth was seen across both units and dollars when compared to FIFA 23's September 2022 launch month. EA Sports FC 24 launched as the 14th best-selling game of 2023 year-to-date ending September.
Mobile
In Mobile content, Sensor Tower reports the top 10 games by U.S. consumer spending in September as: MONOPOLY GO!, Royal Match, Roblox, Candy Crush Saga, Pokémon GO, Coin Master, Gardenscapes, Jackpot Party – Casino Slots, Evony and Homescapes.
"US mobile gaming spend in September 2023 showed a modest increase (+4.3%) compared to September 2022," said Samuel Aune of Sensor Tower. "Interestingly, the list of top ten mobile games by revenue in the US did not change at all compared to last month!"
"MONOPOLY GO! remains firmly on top, with the #2 to #4 games Royal Match, Roblox, and Candy Crush clustered together, but trailing Scopely's hit by a wide margin. Spend in Pokémon GO came down from the high of August, Pokémon GO's World Championships month," said Aune.
Accessories
Accessories spending during September increased 11% when compared to a year ago, to $197 million. Gamepad spending increased by 15% in the month compared to a year ago, while Racing Controller spending grew by 18%.
The PS5 Dual Sense Wireless Controller – Marvel's Spider-Man 2 Limited Edition was the best-selling accessory of the month in consumer spending.
Software charts

Year To Date

Nintendo / PlayStation / Xbox charts are no longer being reported.
Rankings
Units: PS5 > XBS > NSW
Revenue: PS5 > XBS > NSW
YTD Units: PS5 > NSW > XBS
YTD Revenue: PS5 > NSW > XBS
Welfare's estimation from InstallBase
PS5: 480K
XBS: 300K
NSW: 200K
Full Estimations for 2023
Results for 2022 (NSW monthly numbers are Welfare's estimations but it's total is from NPD. PS5 and XBS monthly and total numbers are from NPD)
NPD 2022 Yearly and Lifetime sales
State of the market
September 2023 US Video Game Market Highlights from Circana - U.S. consumer spending on video game content, hardware and accessories grew 10% compared to a year ago, totaling $4.5B. Growth in spending on video game content and accessories offset an 8% decline in hardware.
Spending on video game content in September increased 13% vs YA, reaching $3.8B. Growth in digital premium download spending across console & PC drove most of the gains. Non-mobile subscription spending fell 2%, while Sensor Tower reported mobile spending growth of 4%.

Hardware
Video game hardware spending fell 8% when compared to a year ago, to $451 million. Single-digit percentage growth in consumer spending on Xbox Series hardware was offset by declines across both PlayStation 5 and Switch.
PlayStation 5 remained the best-selling hardware platform in both unit and dollar sales during September 2023, with Xbox Series again ranking 2nd across both measures.
PlayStation 5 continued to lead the 2023 hardware market across both units and dollars. Year-to-date hardware spending was 10% higher when compared to the same period in 2022, at $3.7 billion.
Software
Starfield was the best-selling game of September, instantly becoming the 7th best-selling game of 2023 year-to-date. Starfield ranked as the best-selling title of the month across both Xbox and PC, with PC being its lead sales platform.
Mortal Kombat 1 debuted as the 2nd best-selling game of September and the #8 best-selling game of 2023 YTD. Mortal Kombat 1 was the best-selling game of the month on PlayStation platforms, placed 2nd on both Xbox and PC, and ranked 3rd on Nintendo Switch.
EA Sports FC 24 was the 3rd best-selling game of September. Double-digit percentage growth was seen across both units and dollars when compared to FIFA 23's September 2022 launch month. EA Sports FC 24 launched as the 14th best-selling game of 2023 year-to-date ending September.
Mobile
In Mobile content, Sensor Tower reports the top 10 games by U.S. consumer spending in September as: MONOPOLY GO!, Royal Match, Roblox, Candy Crush Saga, Pokémon GO, Coin Master, Gardenscapes, Jackpot Party – Casino Slots, Evony and Homescapes.
"US mobile gaming spend in September 2023 showed a modest increase (+4.3%) compared to September 2022," said Samuel Aune of Sensor Tower. "Interestingly, the list of top ten mobile games by revenue in the US did not change at all compared to last month!"
"MONOPOLY GO! remains firmly on top, with the #2 to #4 games Royal Match, Roblox, and Candy Crush clustered together, but trailing Scopely's hit by a wide margin. Spend in Pokémon GO came down from the high of August, Pokémon GO's World Championships month," said Aune.
Accessories
Accessories spending during September increased 11% when compared to a year ago, to $197 million. Gamepad spending increased by 15% in the month compared to a year ago, while Racing Controller spending grew by 18%.
The PS5 Dual Sense Wireless Controller – Marvel's Spider-Man 2 Limited Edition was the best-selling accessory of the month in consumer spending.
Software charts

Year To Date

Nintendo / PlayStation / Xbox charts are no longer being reported.
Rankings
Units: PS5 > XBS > NSW
Revenue: PS5 > XBS > NSW
YTD Units: PS5 > NSW > XBS
YTD Revenue: PS5 > NSW > XBS
Welfare's estimation from InstallBase
PS5: 480K
XBS: 300K
NSW: 200K
Full Estimations for 2023
| Month | PS5 | XBS | NSW |
|---|---|---|---|
| Jan-23 | 430,000 | 200,000 | 280,000 |
| Feb-23 | 560,000 | 240,000 | 290,000 |
| Mar-23 | 660,000 | 280,000 | 340,000 |
| Apr-23 | 360,000 | 180,000 | 420,000 |
| May-23 | 270,000 | 160,000 | 450,000 |
| Jun-23 | 430,000 | 240,000 | 350,000 |
| Jul-23 | 270,000 | 160,000 | 240,000 |
| Aug-23 | 360,000 | 210,000 | 200,000 |
| Sep-23 | 480,000 | 300,000 | 200,000 |
| YTD | 3,830,000 | 1,970,000 | 2,770,000 |
Results for 2022 (NSW monthly numbers are Welfare's estimations but it's total is from NPD. PS5 and XBS monthly and total numbers are from NPD)
| Month | PS5 | XBS | NSW |
|---|---|---|---|
| Jan-22 | 369,000 | 307,000 | 270,000 |
| Feb-22 | 128,000 | 261,000 | 410,000 |
| Mar-22 | 282,000 | 489,000 | 540,000 |
| Apr-22 | 234,000 | 267,000 | 365,000 |
| May-22 | 119,000 | 177,000 | 270,000 |
| Jun-22 | 277,000 | 260,000 | 385,000 |
| Jul-22 | 301,000 | 147,000 | 310,000 |
| Aug-22 | 341,000 | 251,000 | 295,000 |
| Sep-22 | 494,00 | 288,000 | 325,000 |
| Oct-22 | 456,000 | 261,000 | 250,000 |
| Nov-22 | 1,328,000 | 730,000 | 920,000 |
| Dec-22 | 1,331,000 | 942,000 | 1,490,000 |
| Total | 5,660,000 | 4,480,000 | 5,830,000 |
NPD 2022 Yearly and Lifetime sales
| 2022 | LTD | |
|---|---|---|
| NSW | 5,830,000 | 39,410,000 |
| PS5 | 5,660,000 | 11,900,000 |
| XBS | 4,480,000 | 9,700,000 |
| PS4 | 50,000 | 34,760,000 |
Last edited:


