Luminoth-4545
Member
Credit: Welfare

 www.installbaseforum.com
Platform specific software charts make a return!
State of the market
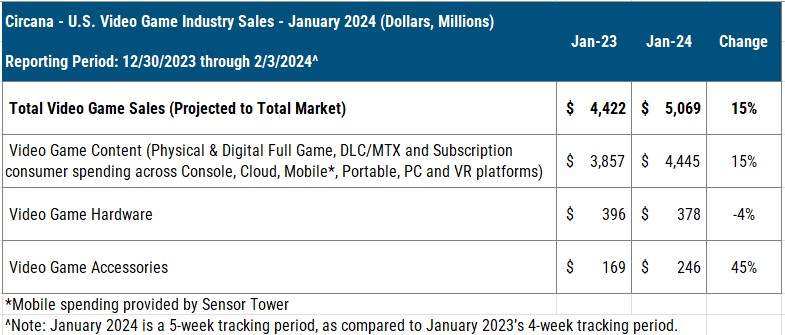
Projected total market spending on video game hardware, content and accessories grew 15% in January compared to a year ago, reaching $5.1B. Note: January 2024 was a 5-week period, while January 2023 was a 4-week period. A 15% increase in total projected spending on video game content drove the market's overall gain. Growth in digital content spending across Console, PC and VR platforms, along with a 5% increase in mobile games spending (mobile source: Sensor Tower) led the way.
Hardware
January video game hardware spending fell 4% when compared to January 2023, to $378 million. Growth in Xbox Series hardware dollar sales was unable to offset declines across other platforms.
PlayStation 5 was the best-selling hardware platform of January 2024 in both units and dollars, with Switch placing 2nd in unit sales and Xbox Series ranking at #2 in dollar sales.
With 39 months in market, life-to-date unit sales of PlayStation 5 are now tracking 7% ahead of PlayStation 4's pace, and 68% above that of PlayStation 3.
Software
Palworld was January's biggest new release story, ranking 1st in monthly active users on Steam in the US during January according to Circana's Player Engagement Tracker, while placing 3rd on Xbox platforms behind only Fortnite and Call of Duty HQ.
Fortnite once again led in monthly active users across both PlayStation 5 and Xbox Series consoles, with Call of Duty HQ ranking 2nd across both platforms.
Enshrouded was the only new release outside of Palworld to rank among the top 10 titles in US monthly active users on tracked platforms, placing 7th on Steam during the month.
Being added to January's PlayStation Plus Monthly Games lineup helped Evil West jump to 7th on the PS5 monthly active user chart after placing 378th in December. On Xbox Series, Hell Let Loose rose from #168 in December to 8th in January driven by its inclusion in Xbox Game Pass.
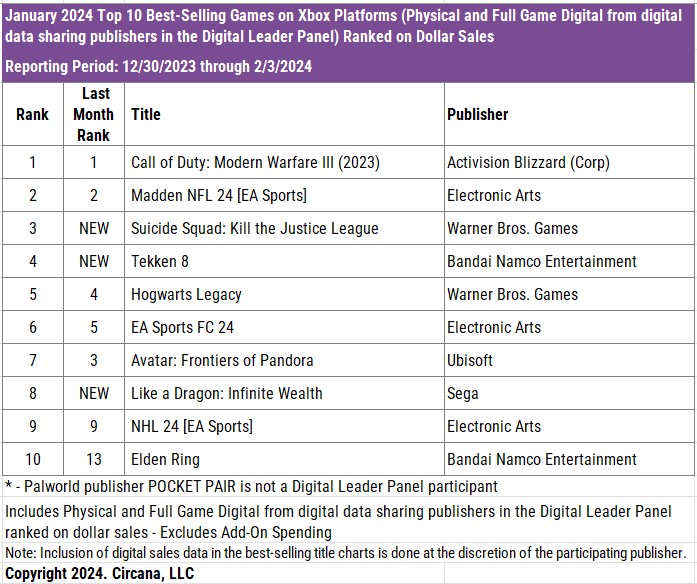
6 new releases appeared on January's top 20 best-selling tracked titles chart. Leading all new releases was Bandai Namco Entertainment's Tekken 8, which ranked 2nd during January, with both unit and dollar sales growth compared to the June 2017 release of Tekken 7.
Mobile
Sensor Tower reports the top 10 mobile games by U.S. consumer spend in Jan as: MONOPOLY GO!, Royal Match (+1), Roblox (-1), Candy Crush Saga, Coin Master (+1), Township (+5), Whiteout Survival (+5), Jackpot Party – Casino Slots (+2), Clash of Clans (-4) and Pokémon GO (-2). The highlights of this month are Township and Whiteout Survival, both of which jumped up five ranks to take middle spots in the top ten list," said Samuel Aune of Sensor Tower. "Township's revenue spiked on Jan 19th, coinciding with the... Brazilian Carnival in-app event."
"The higher-level trend here is that Playrix and other publishers are continuing to find success monetizing their existing audiences through live ops in a time when targeted user acquisition costs are high," - Samuel Aune, Sensor Tower
Accessories
Spending on video game accessories increased 45% when compared to January 2023, to $246 million. Gamepad spending increased by over 50% year-on-year. The PlayStation 5 Dual Sense Edge was the best-selling video game accessory of January in dollar sales.
PlayStation Portal was shifted from the Hardware category to Accessories with January data. PlayStation Portal ranked 5th among video game accessories in consumer spending during January.
Software Charts

Playstation

Xbox
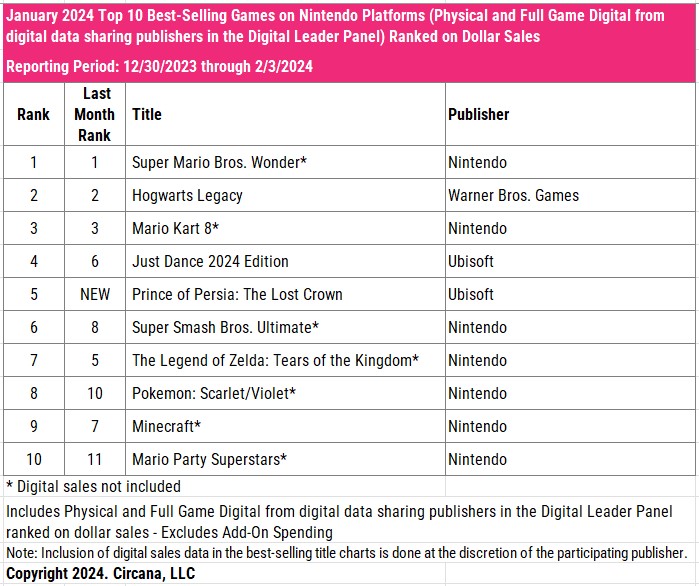
Switch
Monthly Active User Engagement
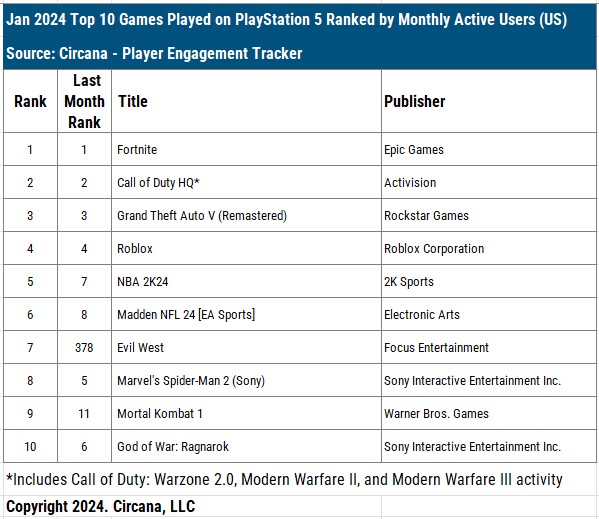

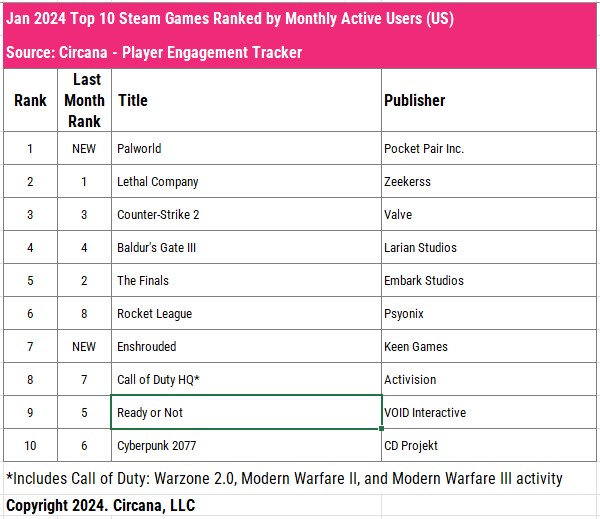
Rankings
Units: PS5 > NSW > XBS
Revenue: PS5 > XBS > NSW
Thanks Mat Piscatella!
Other info
Xbox being up yoy for units and PS5 being up 7% over PS4 launch aligned roughly gives us this
PS5: < 450K > 400K
NSW: < 300K > XBS
XBS: > 200K
Welfare's Estimates
PS5: 420K
NSW: 250K
XBS: 210K

Circana January 2024: #1 MWIII #2 Tekken 8 #3 Suicide Squad #4 Persona 3; PS5 #1 Units + Rev, Switch #2 Units Xbox #2 Rev
State of the market Projected total market spending on video game hardware, content and accessories grew 15% in January compared to a year ago, reaching $5.1B. Note: January 2024 was a 5-week period, while January 2023 was a 4-week period. A 15% increase in total projected spending on video game...
Platform specific software charts make a return!
State of the market
Projected total market spending on video game hardware, content and accessories grew 15% in January compared to a year ago, reaching $5.1B. Note: January 2024 was a 5-week period, while January 2023 was a 4-week period. A 15% increase in total projected spending on video game content drove the market's overall gain. Growth in digital content spending across Console, PC and VR platforms, along with a 5% increase in mobile games spending (mobile source: Sensor Tower) led the way.

Hardware
January video game hardware spending fell 4% when compared to January 2023, to $378 million. Growth in Xbox Series hardware dollar sales was unable to offset declines across other platforms.
PlayStation 5 was the best-selling hardware platform of January 2024 in both units and dollars, with Switch placing 2nd in unit sales and Xbox Series ranking at #2 in dollar sales.
With 39 months in market, life-to-date unit sales of PlayStation 5 are now tracking 7% ahead of PlayStation 4's pace, and 68% above that of PlayStation 3.
Software
Palworld was January's biggest new release story, ranking 1st in monthly active users on Steam in the US during January according to Circana's Player Engagement Tracker, while placing 3rd on Xbox platforms behind only Fortnite and Call of Duty HQ.
Fortnite once again led in monthly active users across both PlayStation 5 and Xbox Series consoles, with Call of Duty HQ ranking 2nd across both platforms.
Enshrouded was the only new release outside of Palworld to rank among the top 10 titles in US monthly active users on tracked platforms, placing 7th on Steam during the month.
Being added to January's PlayStation Plus Monthly Games lineup helped Evil West jump to 7th on the PS5 monthly active user chart after placing 378th in December. On Xbox Series, Hell Let Loose rose from #168 in December to 8th in January driven by its inclusion in Xbox Game Pass.
6 new releases appeared on January's top 20 best-selling tracked titles chart. Leading all new releases was Bandai Namco Entertainment's Tekken 8, which ranked 2nd during January, with both unit and dollar sales growth compared to the June 2017 release of Tekken 7.
Mobile
Sensor Tower reports the top 10 mobile games by U.S. consumer spend in Jan as: MONOPOLY GO!, Royal Match (+1), Roblox (-1), Candy Crush Saga, Coin Master (+1), Township (+5), Whiteout Survival (+5), Jackpot Party – Casino Slots (+2), Clash of Clans (-4) and Pokémon GO (-2). The highlights of this month are Township and Whiteout Survival, both of which jumped up five ranks to take middle spots in the top ten list," said Samuel Aune of Sensor Tower. "Township's revenue spiked on Jan 19th, coinciding with the... Brazilian Carnival in-app event."
"The higher-level trend here is that Playrix and other publishers are continuing to find success monetizing their existing audiences through live ops in a time when targeted user acquisition costs are high," - Samuel Aune, Sensor Tower
Accessories
Spending on video game accessories increased 45% when compared to January 2023, to $246 million. Gamepad spending increased by over 50% year-on-year. The PlayStation 5 Dual Sense Edge was the best-selling video game accessory of January in dollar sales.
PlayStation Portal was shifted from the Hardware category to Accessories with January data. PlayStation Portal ranked 5th among video game accessories in consumer spending during January.
Software Charts

Playstation

Xbox

Switch

Monthly Active User Engagement


Rankings
Units: PS5 > NSW > XBS
Revenue: PS5 > XBS > NSW
Thanks Mat Piscatella!
Other info
Xbox being up yoy for units and PS5 being up 7% over PS4 launch aligned roughly gives us this
PS5: < 450K > 400K
NSW: < 300K > XBS
XBS: > 200K
Welfare's Estimates
PS5: 420K
NSW: 250K
XBS: 210K
Last edited:

