Luminoth-4545
Member
https://www.installbaseforum.com/fo...k-nsw-1-units-ps5-1-revenue.1628/#post-159750
State of the market
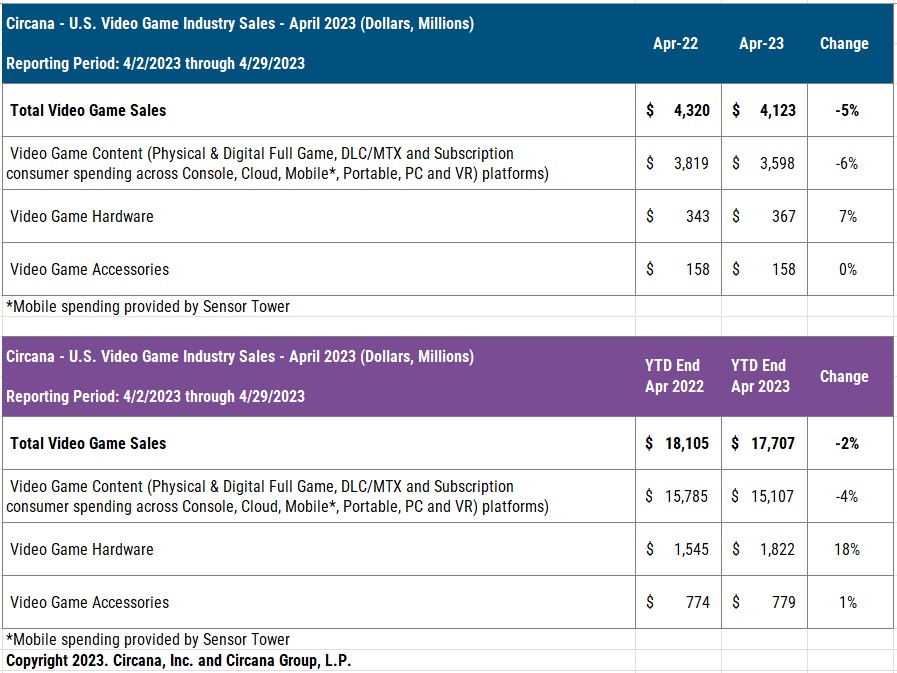
Consumer spending on video game content, hardware and accessories reached $4.1 billion, a 5% drop when compared to a year ago. A 6% decline in April spending on video game content offset 7% growth in hardware.
Year-to-date consumer spending on video game content, hardware and accessories fell 2% when compared to the same period in 2022, to $17.7 billion.

Hardware
Video game hardware spending grew 7% when compared to YA, to $367M. This is the highest video game hardware spend for an April month since the $420M reached in April 2020. Double-digit percentage growth in both PS5 and Switch dollar sales offset declines on other platforms.
PlayStation 5 was the best-selling hardware platform in dollar sales during April, while Switch led the market in units sold. PlayStation 5 leads the 2023 hardware market year-to-date across both units and dollars.
Software
-
Mobile
Sensor Tower reports the top 10 games by U.S. consumer spending in April as: Candy Crush Saga, Roblox, Royal Match, Coin Master, Gardenscapes, Evony, Township, Jackpot Party, Homescapes, and Bingo Blitz.
"Pokémon Go fell out of the top ten for the first time since April of last year," said Dennis Yeh of Sensor Tower. "Spend trends were relatively stable in April with no major shifts in subgenre spend from March."
Accessories
Accessories spending during April was flat when compared to a year ago, at $158 million. The PlayStation 5 Dual Sense Edge Wireless Controller Black was the best-selling accessory in dollar sales for both April and 2023 year-to-date.
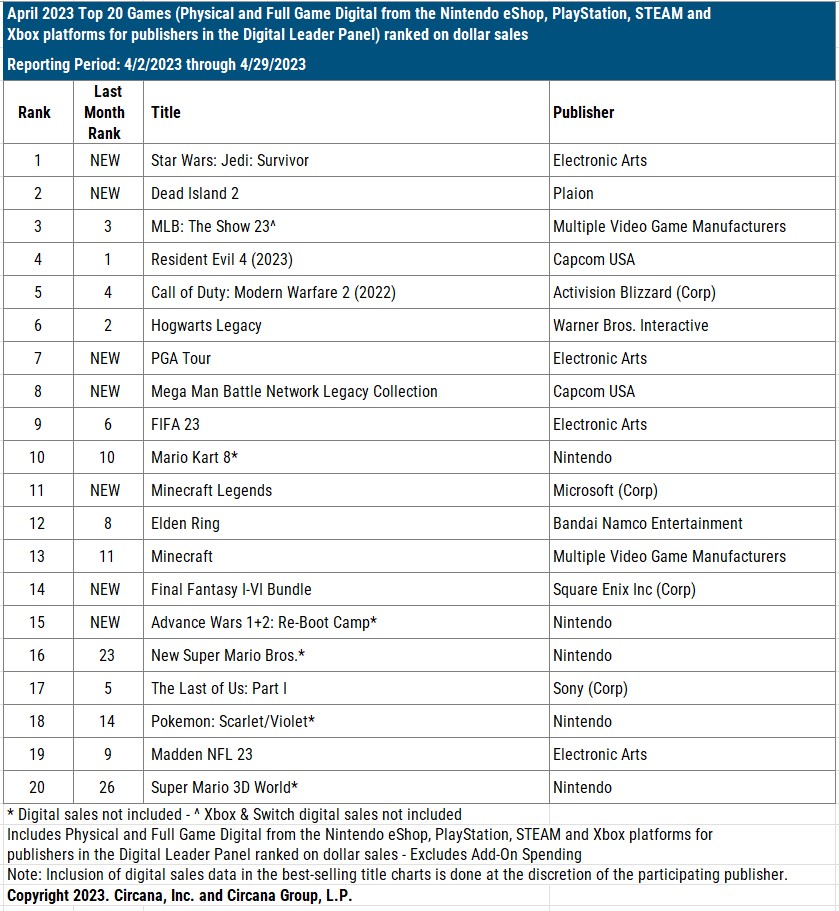
Software charts

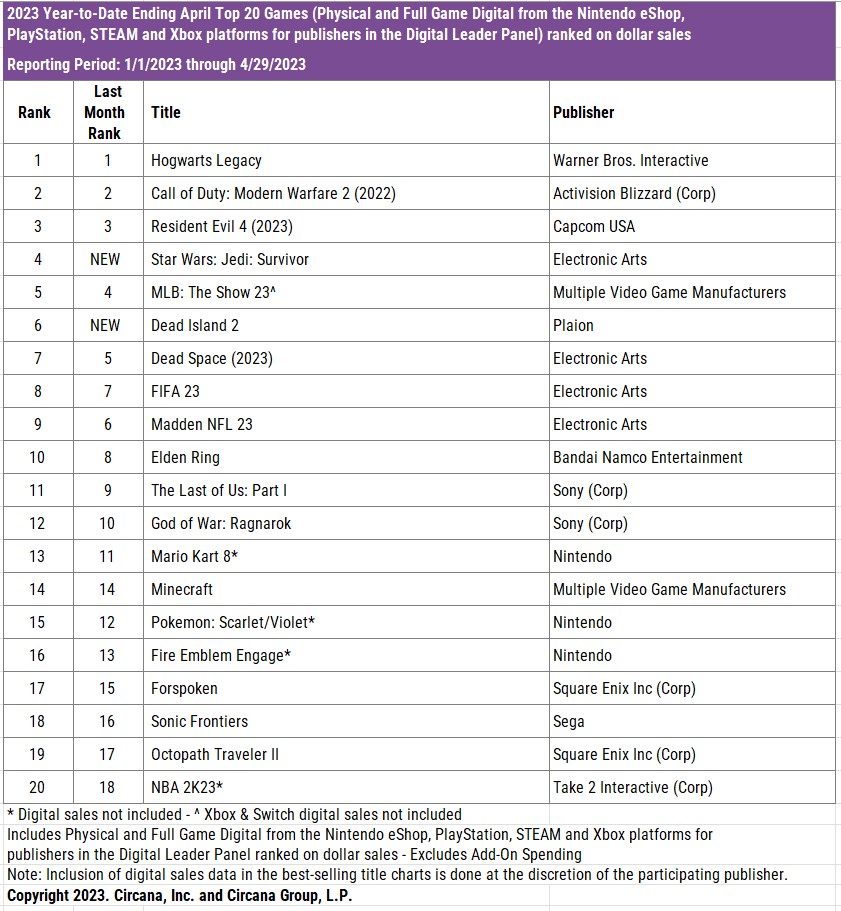
Year To Date

Nintendo / PlayStation / Xbox charts are no longer being reported.
Rankings
Units: NSW > PS5 > XBS
Revenue: PS5 > NSW > XBS
YTD Units: PS5 > NSW > XBS
YTD Revenue: PS5 > NSW > XBS
Thanks Mat Piscatella!
State of the market
Consumer spending on video game content, hardware and accessories reached $4.1 billion, a 5% drop when compared to a year ago. A 6% decline in April spending on video game content offset 7% growth in hardware.
Year-to-date consumer spending on video game content, hardware and accessories fell 2% when compared to the same period in 2022, to $17.7 billion.

Hardware
Video game hardware spending grew 7% when compared to YA, to $367M. This is the highest video game hardware spend for an April month since the $420M reached in April 2020. Double-digit percentage growth in both PS5 and Switch dollar sales offset declines on other platforms.
PlayStation 5 was the best-selling hardware platform in dollar sales during April, while Switch led the market in units sold. PlayStation 5 leads the 2023 hardware market year-to-date across both units and dollars.
Software
-
Mobile
Sensor Tower reports the top 10 games by U.S. consumer spending in April as: Candy Crush Saga, Roblox, Royal Match, Coin Master, Gardenscapes, Evony, Township, Jackpot Party, Homescapes, and Bingo Blitz.
"Pokémon Go fell out of the top ten for the first time since April of last year," said Dennis Yeh of Sensor Tower. "Spend trends were relatively stable in April with no major shifts in subgenre spend from March."
Accessories
Accessories spending during April was flat when compared to a year ago, at $158 million. The PlayStation 5 Dual Sense Edge Wireless Controller Black was the best-selling accessory in dollar sales for both April and 2023 year-to-date.
Software charts

Year To Date

Nintendo / PlayStation / Xbox charts are no longer being reported.
Rankings
Units: NSW > PS5 > XBS
Revenue: PS5 > NSW > XBS
YTD Units: PS5 > NSW > XBS
YTD Revenue: PS5 > NSW > XBS
Thanks Mat Piscatella!
Last edited:


