Even if instead of units it's gross software revenue generated by either first or third party software, the percentage should still be roughly similar and still too high: always above around two thirds or three quarters from first-party depending on the quarter or year.
That percentage of first party sales (in case of this quarter covering Switch 1+2, not just Switch 2) pretty much matched the one seen in Switch 2 software units sold of total vs Mario Kart World.
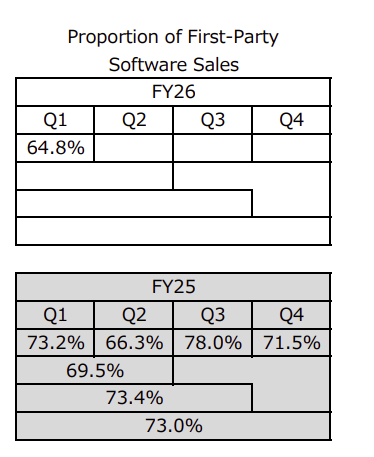
Missing percentages of first-party sales:
FY24 Q1 88.8%
FY24 Q2 72.1%
FY24 Q3 82.6%
FY24 Q4 74.9%
FY25 Q1 73.2%
FY25 Q2 66.3%
FY25 Q3 78.0%
FY25 Q4 71.5%
FY26 Q1 64.8%
Nintendo traditionally had lower seller releases during every Q1 and specially Q2, so traditionally 3rd parties had better percentages during these quarters, while in the non-Nintendo gaming platforms has been historically the opposite: most units and revenue generated by 3rd party sofware instead.
During FY25 and maybe FY24 too, Nintendo was also softer regarding the profile of big seller releases, pretty likely because decided to save the top seller ones (Mario Kart, mainline Mario, mainline Zelda, Pokemon, Smash Bros, Animal Crossing...) for Switch 2. So 3rd parties got a slightly better percentage during that transitional period.